Quarterly Regional Review
Recovery in London market confirmed in third quarter
- London leads house price growth in England in the third quarter
- House price growth in Northern Ireland breaks all records
- South speeds ahead of the North
Quarterly index – Headlines |
Q3 2006 |
Q2 2006 |
Q1 2006 |
Q4 2005 |
UK All Properties Index (Q1 1993 =100)* |
333.5 |
326.5 |
323.0 |
315.9 |
Quarterly change* |
2.1% |
1.1% |
2.3% |
1.3% |
Annual change |
6.9% |
4.8% |
4.9% |
3.2% |
Average price in quarter |
£168,460 |
£165,035 |
£160,319 |
£157,387 |
* seasonally adjusted
Commenting on the figures Fionnuala Earley, Nationwide’s Group Economist, said:
“The annual rate of house price inflation in the UK increased to 6.9% in the third quarter. This is the fastest rate of annual growth since Q1 2005. The rate of house price growth also accelerated between July and September when the quarterly rate increased to 2.1%, almost twice the rate of the previous quarter. The price of a typical house has increased to £168,460, up from £157,627 this time last year. This is the equivalent to a price increase of £30 per day in the last year.
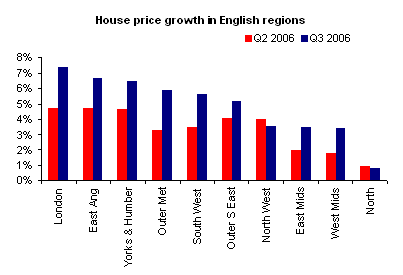
“House prices increased in every region of the UK over the last twelve months, supported by robust economic conditions and high levels of immigration across all parts of the UK. Northern Ireland and Scotland continued to see double digit house price growth, but Wales lagged behind the average for the UK with an annual rate of 4.6%. Within the English regions, the London market was the best performer with annual house price growth of 7.3%. The Northern region, where prices increased by only 0.8%, saw the slowest growth in house prices of anywhere in the UK.
London market steps out in front in England …
“The London market stepped out in front of all other English regions in the third quarter. Prices in the capital increased by 7.3% in the last year, compared with the average in England of 5.3% and the UK average of 6.9%. During the quarter the rate of price growth accelerated to 2.5%, up from 1.7% in Q2 2006. The price of a typical property in London is now £259,646 - 40% higher than the average price in England and 54% higher than the average price in the UK.
“House prices grew strongly across all parts of London over the last twelve months, but the strongest growth was in the most expensive part of the capital . Part of the explanation for this may lie in anecdotal evidence of large numbers of wealthy overseas buyers attracted to super-prime property in London because of its status as a thriving city and successful financial centre. While many of these may be cash buyers, the effect of this demand on prices in the super-prime sector has knock on effects on all house prices in the vicinity.
… but Northern Ireland price growth breaks all records
“House prices in Northern Ireland increased by an incredible 33.4% in the last twelve months. This is the fastest ever rate of growth in Northern Ireland and almost five times faster than the average for the UK. A strong jobs market, high levels of immigration and a booming housing market in te Republic of Ireland have helped to contribute to this. House prices in the parts of the Province closest to the border have increased most quickly. This could be due to lower house prices north of the border attracting demand from the Republic. The average price of a house in the Republic of Ireland is over £200,000 compared with the Northern Ireland average of £159,859.
“Scotland also maintained its strong performance with prices increasing by 15.2% in the last year. Annual house price growth in Scotland has been in double digits for most of the four years. Despite this, it is still the second cheapest place in the UK with a typical house price of £135,846.
“The Welsh housing market underperformed the UK for three out of the last four quarters. The annual rate of house price inflation was 4.6% in the third quarter, compared with 6.9% in the UK. The quarterly rate of house price growth slowed to 1.1% from 1.3% in Q2. The underperformance means that the value of a typical house in Wales is 86% of the UK value, compared with 88% this time last year.
South speeds ahead of the North …
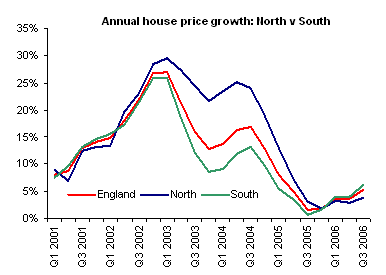
“The average rate of growth of prices in the south of England outperformed those in the North in the third quarter, confirming the turnaround of fortunes between North and South. The annual rate of growth of prices in the North of England is now 3.8%, compared to 6.2% in the South. House prices in the North were catching up with the South for more than three and a half years between Q2 2002 and Q4 2005. During that period the average price in the North increased from 70% to 80% of the average price in England.
… but Yorkshire and Humberside bucks the trend.


“However, not all parts of the North are underperforming. Yorkshire and Humberside saw the third fastest annual rate of growth in England in the third quarter, behind London and East Anglia. Prices increased by 6.4% in Yorkshire and Humberside in the last twelve months and during the third quarter the rate of growth accelerated to 2.3%, up from 0.3% in Q2 2006. In contrast the Northern region saw a small fall in prices between July and September. Prices fell by 0.5% during the third quarter bringing the annual rate of growth down to only 0.8% - the slowest rate of growth in the UK. Wales, the North West and Northern regions were the only regions in the UK where the annual rate of house price growth slowed in the third quarter.
“Not all parts of the South are enjoying above average house price growth. Only the London market has enjoyed house price growth above the UK average. While East Anglia has the second fastest growth rate in England at 6.7%, other areas close to London have performed less well. Even though house price growth accelerated in the third quarter, the annual rate of house price growth in the Outer Metropolitan and Outer South East regions remained close to the average for England, rising by 5.8% and 5.2% respectively.”
Regional Headlines |
||||
|
Quarterly |
Annual |
Average |
All properties Index 1993 Q1=100 (sa) |
North |
-0.5% |
0.8% |
£125,495 |
274.7 |
Yorkshire & Humberside |
2.3% |
6.4% |
£148,585 |
302.6 |
North West |
0.5% |
3.5% |
£151,198 |
292.6 |
East Mids |
2.0% |
3.5% |
£149,783 |
330.3 |
West Mids |
1.0% |
3.4% |
£157,896 |
302.8 |
East Ang |
2.0% |
6.7% |
£172,002 |
339.9 |
Outer S East |
1.4% |
5.2% |
£195,555 |
359.1 |
Outer Met |
2.0% |
5.8% |
£232,894 |
336.1 |
London |
2.5% |
7.3% |
£259,646 |
387.8 |
South West |
1.2% |
5.6% |
£186,824 |
346.3 |
Wales |
1.1% |
4.6% |
£145,672 |
300.8 |
Scotland |
4.7% |
15.2% |
£135,846 |
258.9 |
N Ireland |
8.7% |
33.4% |
£159,859 |
462.4 |
UK |
2.1% |
6.9% |
£168,460 |
336.1 |
Fionnuala Earley Zoe Stevens
Group Economist Press Officer
Tel: 01793 656370 Tel: 01793 655423
Think carefully before securing other debts against your home, your home may be repossessed if you do not keep up repayments on your mortgage.
Go Direct.co.uk is a trading style for website purposes of Go Direct UK Ltd.
Go Financial Services is a trading style of Go Direct UK Ltd which is an appointed representative of Personal Touch Financial Services Ltd which is authorised and regulated by the Financial Conduct Authority. Registered in England & Wales Company 5703224. FCA Number 456600
We normally do not charge a fee for mortgage advice, however this is dependent on your circumstances. Our typical fee would be £349


