


- Mortgages
- Remortgages
- Bad Credit Mortgages
- Buy to Let Mortgages
- Life Insurance
- Home Ins
- Utility Switch
- Credit Check
- Conveyancing
- About Us
- Terms and Conditions
- Privacy Policy
- Contact Us
- Accessibility
- Site Map
- Mortgage Site Map
- Life Insurance Site Map
- News 2013
- News Achieve 2012
- News Achieve 2011
- News Achieve 2010
- News Achieve 2009
- News Achieve 2008
- News Achieve 2007
- Insurance News Achieve
- Articles Archive
- Recruitment
- ©Copyright 2025

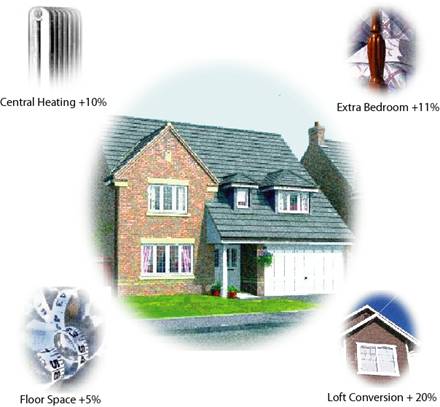
Special Report - What affects the value of your home?
- A 10% increase in floor space adds almost 5% to the price of a typical house and almost 7% to the price of a detached house
- Adding a bedroom and bathroom by way of a loft conversion can add up to 20% to property value
- House values in London are almost double those in Wales when comparing equivalent properties
- Location remains the key to house values
Commenting on the figures Martin Gahbauer, Nationwide’s Chief Economist, said:
“In a buyer’s market homeowners are keen to know which characteristics are likely to make their home relatively more attractive and which ones may detract from the price. Over time, buyers’ expectations have changed and overall the general quality of property in terms of amenities is improving. Location is still the biggest factor affecting the value of property, and a house in the best neighbourhood can command a price nearly 50% higher than a similar house in an ‘average’ area. However, other characteristics also have a significant influence on the desirability, and thus price, of property. For example, extending a property to accommodate an extra bedroom can add around 11% to its price.”
Size matters
Since 1984 the proportion of properties which are under-occupied has increased from 33% to 47% . In housing terms, having more useable space is generally thought to be consistent with better quality accommodation and people are prepared to pay for it. A 10% increase in floor space, all other things being equal, adds almost 5% to the price of a typical house . And, the bigger the property the more people are prepared to pay; a 10% increase in the floor area of a detached house adds almost 7% to the price even when keeping the number of bedrooms constant.
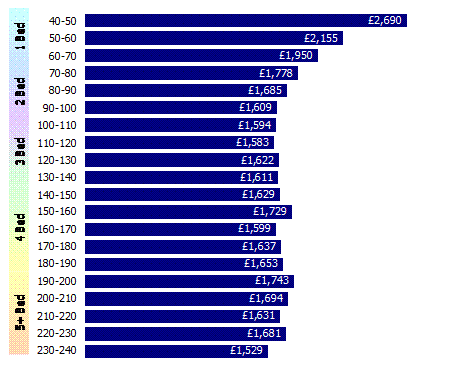
People clearly do value space, although while larger properties cost more to buy, smaller ones have a higher price per square metre. A small one bedroom flat would cost around £2,700 per m² compared to £1,600 per m² for a four bedroom house. The marginal cost per square metre falls largely because it is relatively cheaper to build larger properties.
Chart 1: Average price per square metre
Even though it is relatively cheaper to build a larger property than a smaller one per square metre, today we tend to build smaller properties for the number of bedrooms than we did in the past. Older properties (pre WWII) tend to be much bigger. A 4 bedroom detached older house has around 28m² more space than a newly built one, and typically would cost £60,000 more.
More bedrooms, more value
The conventional way of categorising property in the UK is to look at the number of bedrooms rather than its size in square metres. It seems that households are happy to pay for more space, and adding an extra bedroom can be a good way to increase the value of a property, providing the room is useable:
- Adding a 13m² new double bedroom to a two bedroom house can add about 11% to its value;
- Adding a loft conversion with a bedroom and bathroom of 28m² can add about 20% to the value of a three bedroom, one bathroom house which translates to about £26,000.
Obviously, the more bedrooms a property has the bigger it is likely to be, but this is only partly due to the additional bedroom space. A four bedroom terraced house, for example, is likely to have two or more bathrooms, but it will also generally have more space elsewhere in the form of additional living space – perhaps larger bedrooms or kitchen – compared with a three bedroom terraced. This isn’t so surprising given that properties with more bedrooms would typically accommodate more people and thus require larger living rooms.
The table below shows the value added for different property types by increasing floor area to accommodate an extra bedroom. Semi-detached houses attract the greatest premium for adding a third bedroom, while terraced houses attract the greatest premium for a fourth.
Table 1: Value added by extra bedrooms & floor space
|
2 bed to 3 bed |
3 bed to 4 bed |
Terraced |
11% |
13% |
Semis |
13% |
12% |
Detached |
|
11% |
All Properties |
11% |
11% |
Source: Nationwide
Where do you live?
The old estate agent’s adage of location, location, location still holds true and has, in fact, become more important over time. The difference in price for a similar house in the most and least desirable areas was 72% in 1991, 80% in 2005 and is now 98%. Of course the state that the property is in may also contribute to the difference in price and one might expect that the same size and type of property might be better maintained in a more desirable area – even if only due to peer pressure!
Assuming that the average area is a stereotypical suburban area populated by families in secure occupations, the premium and discounts attributable to other areas can be benchmarked against this . Compared to a typical house in the ‘average’ area, a similar property in a ‘prosperous professionals’ neighbourhood would command a 47% premium, around £75,000 in cash terms. At the other end of the spectrum, a similar property in a ‘hard pressed’ area populated by families struggling to get by would carry a 26% discount (around £40,000) against the average property.
Table 2: Premium relative to similar property in ‘average’ area
|
Struggling families |
Blue collar roots |
Wealthy executives |
Prosperous Professionals |
UK |
-26% |
-12% |
+37% |
+47% |
Regional Differences
Clearly location is a major factor in the relative price of properties, but similarly desirable locations in different parts of the country will have vastly different prices. This is due to the big differences in regional incomes and economic performance.
For example, using London as a benchmark, the cost of a similar house in the same type of area in Scotland would be about 40% cheaper. The table below shows how much less a property would cost if it was ‘up-rooted’ from London and placed in a similarly desirable neighbourhood in another region.
Table 3: Relative house values for a typical UK House in different regions
|
Benchmark Property Price |
Average Earnings |
Population Density |
||||
|
Price versus |
Number of properties for one London property |
Price Rank |
Mean gross earnings |
Benchmark Price to Earnings Ratio |
Ratio Rank |
|
|
|||||||
|
|||||||
London |
£250,000 |
1.0 |
1 |
£38,100 |
6.6 |
1 |
4,779 |
Outer Met |
£213,135 |
1.2 |
2 |
£36,618 |
5.8 |
4 |
624 |
Outer SE |
£182,330 |
1.4 |
3 |
£31,166 |
5.9 |
3 |
340 |
South West |
£173,314 |
1.4 |
4 |
£28,289 |
6.1 |
2 |
215 |
West Mids |
£151,715 |
1.6 |
5 |
£27,927 |
5.4 |
5 |
413 |
North West |
£150,366 |
1.7 |
6 |
£28,348 |
5.3 |
7 |
866 |
East Ang |
£149,465 |
1.7 |
7 |
£29,606 |
5.0 |
11 |
182 |
Scotland |
£147,951 |
1.7 |
8 |
£28,731 |
5.1 |
10 |
66 |
Yorks & H |
£144,459 |
1.7 |
9 |
£27,640 |
5.2 |
9 |
334 |
North |
£140,765 |
1.8 |
10 |
£26,682 |
5.3 |
8 |
199 |
N Ireland |
£140,410 |
1.8 |
11 |
£26,156 |
5.4 |
6 |
128 |
East Mids |
£135,353 |
1.8 |
12 |
£28,544 |
4.7 |
13 |
280 |
Wales |
£133,868 |
1.9 |
13 |
£27,058 |
4.9 |
12 |
143 |
Source: Nationwide, ONS Annual Survey of House & Earnings, ONS Social Trends
Note: The above results will be different to our published mix-adjusted series since the above assumes an identical house for all regions whereas our mix-adjusted series considers a typical house for the region being measured.
The benchmark price to earnings ratio compares the price of an identical property in different regions against average gross earnings (for those living in the region). It is interesting to note that the ranks based on this ratio are quite different from those based on the benchmark house price. Whilst London still attracts a significant premium over the rest of the country, even once earnings are taken into account, other regions such as East Anglia and Scotland appear relatively more affordable based on their benchmark price to earnings ratio. Higher benchmark price to earnings ratios indicate a greater willingness to pay for property. This is likely to be driven by demand factors (such as employment) and also supply, including availability of land. To help proxy this, we have included population density in the table above; we would expect land to be at a greater premium in more densely populated areas. This seems to hold true for London and the Outer Metropolitan regions, both of which have higher benchmark price to earnings ratios, and also for Wales and Scotland at the other end of the spectrum. However, this does not hold true across all of the regions, so population density is clearly just one of a number of factors likely to influence relative prices.
Warmer, greener homes
Since 1991, the percentage of homes with full central heating has increased by 10% to 91% . This is now thought to be so much of a norm that those properties without it can now expect a 9% discount on the price compared with an otherwise identical property. This discount has been increasing over time and has risen from 7% in just three years.
Table 4: Value detracted from property from not having central heating
|
Loss of value due to no central heating |
UK |
-9% |
Wales |
-13% |
Scotland |
-10% |
London |
-8% |
While we want warmer homes we have become more aware of fuel costs and also of the increased emphasis on our environmental responsibilities. As a result, households seem to have become increasingly conscious about their energy use. This seems to have led to increased efforts to improve energy efficiency and comfort within the home, for example by installing cavity walls and loft insulation. The increasing popularity of double glazing reflects a change in attitude in this area, with the proportion of owner occupied properties with full double glazing increasing by 11% over the past five years to 64% .
The requirement to have an energy certificate when selling a home now makes it easy to compare the efficiency of different properties on the market. However, even before this, energy efficiency within the housing stock has gradually improved, with the average energy efficiency (SAP) rating for owner occupied properties increasing from 41 to 48, out of a possible 100, between 1996 and 2007. Energy efficiency for ratings on homes is also gauged in terms of the A-G ratings familiar from domestic appliances. 30% of properties now have an energy efficiency rating of A-D. Newer properties tend to be much more energy efficient than older ones, and 90% of properties built after 1990 have an energy efficiency rating of A-D . This may be one of the reasons why new build properties attract a premium price, along with the ‘never lived in’ novelty, no on-going chain and building guarantees. However, with British homes amongst the least energy efficient in Europe and responsible for 27% of the UK’s total carbon emissions , there is plenty of room for improvement, especially given the Government’s target to reduce carbon emissions by 34% by 2020.
In the future, we could see greater use of local alternative energy sources with government grants available for technologies such as solar power cells, wind turbines and ground source heat pumps. It is too early to assess the impact these might have on property prices, particularly as the payback time can be very long, but they could prove to be value-adding features in the future.
Summary
Our research shows that location remains the key to house values, but other factors such as the quality of the property, including the space it offers, are also important . People clearly do value space and appear to be happy to pay for more than they actually need, with nearly half having two or more spare bedrooms. Given this, it is unsurprising that home improvements which increase total floor area, such as a loft conversion, are still typically a good way to add value. But other home improvements which improve the energy efficiency of the property, helping to reduce its carbon footprint and also save money on energy bills, may become more important in the future. Ultimately however, the decision to invest in the home is an individual one, taking into account the costs involved as well as potential benefits.
Martin Gahbauer Roy Beale
Chief Economist Media Relations Officer
Tel: 01793 655434 Tel: 01793 655689
martin.gahbauer@nationwide.co.uk roy.beale@nationwide.co.uk
A ‘typical house’ is a statistical construction representing the mix of UK housing transactions, taking into account characteristics such as location and property type, and has an average floor size of 107m²
4 The Nationwide House Price Index uses a location indicator which groups postcodes according to the characteristics of the locality and the people that live there (we use CACI’s ACORN categorisation). These reflect things like income, occupation and the predominant property types.
Source: WWF UK Report: How Low – Achieving Optimal Carbon Savings from the UK’s existing house stock
Our analysis does not take into account gardens, nor can it adjust for other aspects which are often, by their nature, subjective. Features such as interior design, garden landscaping and fitted kitchens may add value and enhance a property’s saleability, but while one designer’s makeover will add value for some buyers, the same design may detract from the price for others. Improvements finished to a higher standard will be more attractive than ‘bodged’ jobs, but there is a trade off in the cost spent on refurbishment and the price someone else is prepared to pay for it.
Think carefully before securing other debts against your home, your home may be repossessed if you do not keep up repayments on your mortgage.
Go Direct.co.uk is a trading style for website purposes of Go Direct UK Ltd.
Go Financial Services is a trading style of Go Direct UK Ltd which is an appointed representative of Personal Touch Financial Services Ltd which is authorised and regulated by the Financial Conduct Authority. Registered in England & Wales Company 5703224. FCA Number 456600
We normally do not charge a fee for mortgage advice, however this is dependent on your circumstances. Our typical fee would be £349