


Rate of annual house price growth slows in all UK regions
- Annual house price growth slows across the whole of the UK in final quarter of 2007
- The ripple effect is still evident as the North-South gap widens by £15,000 in 2007
- Northern Ireland saw the biggest slowdown in annual house price growth while the West Midlands was the most stable region
- London saw fastest rate of annual house price growth in England for the seventh consecutive quarter
- Northern Ireland and Yorkshire & Humberside saw price falls during the final quarter
UK fact file
Average house price: £183,959 |
Annual percentage increase: 6.9% |
Quarterly change (seasonally adjusted): 1.0% |
Most expensive region: London |
Least expensive region: North |
Region with strongest price growth: Northern Ireland |
Region with weakest price growth: Yorkshire & Humberside |
Quarterly Index - Headlines |
Q4 2007 |
Q3 2007 |
Average price |
£183,959 |
£184,131 |
Annual change % |
6.9% |
9.3% |
Quarterly change % * |
1.0% |
1.6% |
* seasonally adjusted
Text in Blue indicates a hyperlink
Commenting on the figures Fionnuala Earley, Nationwide's Chief Economist, said:
“The annual rate of house price growth slowed in every part of the UK in the final quarter of 2007, bringing the average rate in the UK down from 9.3% to 6.9%. Price growth in Northern Ireland slowed most rapidly with the rate of growth falling to 24.2% from 42.6% in the third quarter. However, annual house price growth in the Province was still faster than anywhere else in the UK and almost twice as fast as the second fastest region, London.
Scotland continued to outperform the UK for the seventeenth consecutive quarter. Prices in Scotland increased by 10.1% in the year to Q4 2007 compared with 12.2% in the year to the previous quarter. In Wales, prices increased by 4.2% over the year, less than half the rate of this time last year. However, Wales was one of the few parts of the UK that saw an acceleration in price growth during the last quarter. Prices increased by 1.5%, more than reversing the 0.3% fall in the third quarter.
With the exception of Yorkshire & Humberside, all of the Northern regions of the UK saw an acceleration in house price growth during the last three months of the year. In contrast all southern regions saw a contraction in both the annual and quarterly growth rate. Northern Ireland and Yorkshire & Humberside stand out, with both recording a fall in house prices during the final quarter of 2007. Northern Ireland saw a 0.2% fall compared with a 2.9% rise in Q3. Yorkshire & Humberside saw prices fall by 0.2%, but this also follows relatively strong growth of 1.1% in the previous quarter.
While the pace of annual house price growth in London slowed to 12.8% from 16.5% in the third quarter, it is still experiencing the fastest rate of growth in England and the second fastest in the UK. The slowdown in the capital’s price growth during the final quarter was steeper than anywhere else in England. In the last three months of the year house prices increased by only 1.2% in London, compared to 3.3% in the previous quarter, although this still remains above the UK average of 1%.
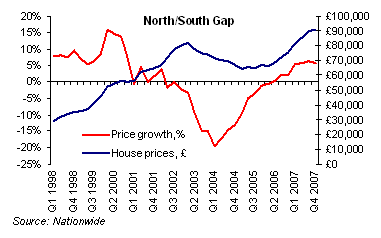 In England, there is a clear north-south divide in the rate of house price growth. London, Outer Metropolitan and Outer South East took the top three rankings respectively for annual house price growth, while the North West, Yorkshire and Humberside and the East Midlands took the bottom three. The North-South gap in both house prices and house price growth has been opening up since 2004. The price of a typical house in the South is now almost £90,000 higher than in the North and the size of the gap in prices has grown by £15,000 since this time last year. In terms of house price growth, prices in the South are increasing at an annual rate of 9%. This is almost three times as fast as in the North, where prices are increasing at 3.4% per year. The price of a typical house in the North is now 64% of the value of a typical southern house. This is similar to the position 10 years ago, but significantly better than 20 years ago when the price of a typical property in the North was only 50% of the price of a typical property in the south.
Is supply an issue in the UK housing market?
Looking forward to 2008, there are many uncertainties, but one of the underlying supportive factors often talked about is the issue of a lack of supply in the UK market. Some questions have been raised about how important this is and how much of a support it will be for the UK market in the future.
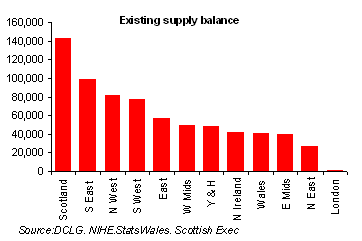
Looking at the total stock of property against the number of households shows that there is an oversupply of actual dwellings in most parts of the UK. One might therefore conclude that supply is not an issue for the UK housing market after all. However, this is a crude measure which does not take into account second homes or those vacant or unfit for habitation. The South East and South West look supply-rich, but we know the biggest concentration of second homes are in these areas which would reduce the available supply balance by around half in each case. In addition, estimates of household and dwelling numbers are subject to much uncertainty and a small error in these estimates can lead to big differences in the overall excess or shortfall of the existing housing stock. Even taking these flaws into account and assuming they have no regional bias, the pattern of the data still suggests that the areas where supply is more of an issue are in the South .
While we cannot be completely sure of the size of the available housing stock, we can have a better idea of the likely demand and supply going forward. A broad measure of the extent of potential excess demand going forward is the difference between projections of the growth in number of households and the number of new properties expected to be built. Starting from the status quo, if there is an insufficient number of properties being built for the number of households being formed – or if the properties being built are in the wrong locations and of the wrong type – there will be an increase in pent-up demand.
How this feeds through to house prices is not entirely clear cut. When affordability conditions are bad, fewer people may set up home than expected due to financial constraints. This reduces demand and thus upward pressure on house prices. But, with affordability having deteriorated for some time the number of these frustrated households may be larger than the projections suggest. This would add to pent-up demand and so be more supportive of house prices. There are, of course, also flaws in household projection data which make it difficult to be precise about the actual size of this pent-up demand. Uncertainty about the levels of net migration going forward is just one. But while we should be cautious about the accuracy of these projections, they are the best available estimate of potential demand from newly forming households available.
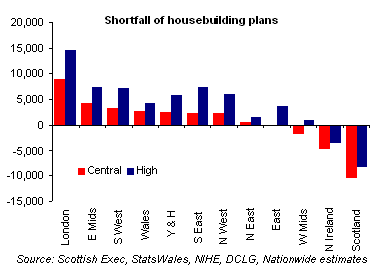
The latest data suggests that there is a big difference between building plans and the numbers of projected households. Current building plans in England fall short of the 240,000 government target by almost 40,000 units per year. With the average expected growth in the number of households expected to average 223,000 per year this leaves a shortfall of at least 22,000 and up to 55,000 if higher assumptions of migration are used. The biggest shortfalls are in London and the South East. Scotland and Northern Ireland do not appear to have a problem with the volume of homes available, but with recent rapid increases in price, the affordability of homes is more of an issue, particularly in Northern Ireland.
While insufficient supply is supportive of house price growth, it does not mean that prices will continue to increase at the pace of recent years. In a period of poor affordability or uncertainty, demand can become more elastic and even those who want to start up an independent home can be frustrated by financial or other constraints. In the short-term supply issues are likely to provide some support in the areas where supply constraints are most critical, but over the longer term, the growth in pent-up demand is likely to mean that the market will turn around more rapidly once confidence and affordability have been restored to more usual levels.”
Regional Headlines
Region |
Average Price |
Average First-Time Buyer house price |
Quarterly % change |
Annual % change |
North |
£133,202 |
£107,726 |
1.2% |
3.7% |
Yorkshire & Humberside |
£154,695 |
£121,120 |
-0.2% |
2.6% |
North West |
£159,062 |
£120,965 |
1.3% |
3.5% |
East Midlands |
£155,141 |
£126,049 |
0.4% |
2.8% |
West Midlands |
£164,855 |
£131,653 |
1.8% |
4.4% |
East Anglia |
£183,598 |
£145,671 |
1.2% |
5.7% |
Outer South East |
£214,634 |
£170,610 |
0.6% |
7.2% |
Outer Metropolitan |
£259,160 |
£198,936 |
1.0% |
8.5% |
London |
£303,739 |
£261,426 |
1.2% |
12.8% |
South West |
£203,049 |
£162,906 |
0.3% |
6.4% |
Wales |
£154,947 |
£128,349 |
1.5% |
4.2% |
Scotland |
£151,178 |
£111,140 |
1.8% |
10.1% |
Northern Ireland |
£224,816 |
£191,152 |
-0.2% |
24.2% |
UK |
£183,959 |
£156,892 |
1.0% |
6.9% |
Approx 109,000, or 45% second homes in England are in the South East and South West Survey of English Housing
Major Towns and Cities
5 hottest regional towns/cities
Rank |
Town / City |
Annual % Change |
Average Price |
1 |
Belfast |
32% |
£306,698 |
2 |
Aberdeen |
25% |
£234,041 |
3 |
London |
16% |
£329,007 |
4 |
Oxford |
13% |
£339,404 |
5 |
St Albans |
13% |
£347,563 |
5 coolest regional towns/cities
Rank |
Town / City |
Annual % Change |
Average Price |
1 |
Durham City |
-3% |
£152,902 |
2 |
Newcastle |
-3% |
£178,309 |
3 |
Sunderland |
-1% |
£147,966 |
4 |
Nottingham |
0% |
£151,135 |
5 |
Sheffield |
1% |
£181,630 |
Scotland
Average house price: £151,178 |
Annual percentage increase: 10.1% |
Quarterly change (seasonally adjusted): 1.8% |
Most expensive area: Edinburgh City |
Least expensive area: Fife |
Area with strongest price growth: Aberdeen City |
Area with weakest price growth: Southern Scotland |
The annual rate of growth of house prices in Scotland slowed for the fourth consecutive quarter. Prices in Scotland are now 10.1% higher than a year ago, the equivalent of an increase of £38 per day during the year. The pace of growth during the last three months also moderated, falling from 2.4% to 1.8% - its slowest pace since Q3 2005. However, Scotland, along with the West Midlands, saw the fastest rate of growth over the last three months in the whole UK. House price inflation in Scotland remains well above the average for the whole of the UK and has now outperformed the UK average for more than four years. However, the price of a typical house is still almost £33,000 less than the average price for the UK, making Scotland the second cheapest place to buy a house, behind the Northern region of England.
Price developments continue to be characterised by wide disparities within Scotland. Edinburgh remains by far the most expensive place to buy a home, but Aberdeen is catching up, with price growth of 25% over the past twelve months. Fife is the cheapest region, followed by Southern Scotland, with prices in both regions more than £100,000 less than in Edinburgh.
Looking forward to 2008 we expect that Scotland will continue to perform well compared to other parts of the UK. We expect price increases of around 4% in Scotland in 2008.
Click here for Scotland’s sub-regional data
Wales
Average house price: £154,947 |
Annual percentage increase: 4.2% |
Quarterly change (seasonally adjusted): 1.5% |
Most expensive area: Cardiff |
Least expensive area: South Wales (West) |
Area with strongest price growth: South Wales (East) |
Area with weakest price growth: South Wales (West) |
House prices in Wales increased at an annual rate of 4.2% in Q4 2007, well below the UK average of 6.9%. However prices increased by 1.5% in the last three months of the year, the third fastest rate of growth in the UK behind Scotland and the West Midlands. This reversed the 0.3% fall in prices in the third quarter. House prices in Wales increased at an average rate of £17 per day in 2007.
Within Wales, South Wales (East) continued to perform most strongly. Overall this sub-region of Wales saw prices increase at an annual rate of 9% slightly slower than the 12% achieved in Q3 2007, but still much faster than anywhere else in Wales. Caerphilly saw prices increase by 21% over the last year and Newport by 11%. Swansea, in the South Wales (East) region saw no increase in prices over the last year, while Cardiff saw prices increase by 4%.
Looking forward we expect that house price growth in Wales will be much weaker in 2008 than in 2007 and expect prices in Wales to fall by around 1%.
Click here for Wales sub-regional data
Northern Ireland
Average house price: £224,816 |
Annual percentage increase: 24.2% |
Quarterly change (seasonally adjusted): -0.2% |
Most expensive area: City of Belfast |
Least expensive area: Northern Ireland (West) |
Area with strongest price growth: Northern Ireland (North |
Area with weakest price growth: Northern Ireland (West) |
The Northern Irish housing market is still outperforming any other part of the UK, with prices increasing at an annual rate of 24.2%. However, the rate of slowdown in the province is faster than in any other part of the UK. Annual house price growth is now less than half that of six months ago. Indeed in the first half of 2007 prices in Northern Ireland grew at an average annual rate of over 55%. During the final three months of the year prices in Northern Ireland fell by 0.2%. This is the first fall recorded in the Province for six years (Q4 2001). However, on average the value of a property in Northern Ireland increased by £120 per day in 2007.
The severe deterioration in affordability is a major factor in Northern Ireland and a major reason why we expect Northern Ireland to perform less well compared with other parts of the UK in 2008. We also believe that lower house price growth expectations will cool demand more rapidly in Northern Ireland, particularly because of the phenomenal growth it has achieved over the last two years. Northern Ireland does not have the same under-supply issue as other parts of the UK and this too will be less supportive for prices next year. We expect prices in Northern Ireland to fall by around 4% in 2008.
Click here for Northern Ireland’s sub-regional data
London
Average house price: £303,739 |
Annual percentage increase: 12.8% |
Quarterly change (seasonally adjusted): 1.2% |
Most expensive borough: Westminster |
Least expensive borough: Barking and Dagenham |
Area with strongest price growth: Haringey |
Area with weakest price growth: Greenwich |
The annual rate of house price growth in London slowed in the final quarter, but remains well ahead of all other parts of England. The annual rate fell to 12.8% compared with 16.5% in the third quarter, but still translates to a daily increase in price of almost £95. However, while prices are still clearly rising at a healthy annual rate in London, the rate of growth during the last three months of the year more than halved to 1.2% from 3.3% in the third quarter.
Very poor affordability conditions, along with turmoil in financial markets which have cast doubt on bonus and employment prospects in the City, mean that London’s housing market will continue to weaken. But with supply constraints in the capital unlikely to go away quickly and with employment required for the Olympics development, there will continue to be some supporting factors for London’s house prices.
Looking into 2008 we expect a much less buoyant housing market in the capital, which is probably at greatest risk from the financial market turmoil than any other part of the UK. We do expect that prices will be around 1% higher at the end of 2008, although there are clearly more uncertainties around this forecast than there were a month ago.
Click here for London’s sub-regional data
England
Average house price: £201,820 |
Annual percentage increase: 6.9% |
Quarterly change (seasonally adjusted): 0.8% |
Most expensive area: London |
Least expensive area: North |
Area with strongest price growth: London |
Area with weakest price growth: Yorkshire & Humberside |
House prices rose by an average of 6.9% in England in the last 12 months, compared to the 9.4% achieved in the third quarter. The price of an average English house is now just over £200,000.
The North-South gap widened further in the fourth quarter. Prices in the south of England increased by 9% in the year, while those in the north increased by only 3.4%. London, Outer Metropolitan and Outer South East took the top three rankings respectively for annual house price growth, while the North West, Yorkshire and Humberside and the East Midlands took the bottom three. Further north, the rate of growth gets weaker. Price growth was strongest in the South at 9%, weaker in the Midlands at 3.7% and weaker still in the north of England at 3.4%.
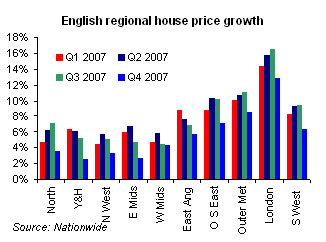
The chart clearly shows how the geographical pattern of house price growth is spread across England. The fastest growth is in London, followed by its immediate neighbours (Outer Metropolitan and Outer South East) and then by the next closest, but still southern regions of East Anglia and the South West. Further north it is difficult to discern a continuation of the London centred ‘ripple effect’, although the next strongest region is the West Midlands. The West Midlands also experienced the most stable rate of house price growth in 2007. East Anglia saw the smoothest deceleration in prices and the East Midlands the sharpest deceleration in prices during the year.
Sub-regional analysis
Just as the national data disguises differences in house prices throughout the UK, looking at the regions disguises movements in local house prices. To look at these developments more closely the areas can be divided into sub-regions.
Scotland (click here to return to commentary)
Nationwide Sub-Regions |
Price in 2007 Q4 |
% change over 10 years |
Annual Chg - Last quarter |
|
Aberdeen City |
£234,041 |
182% |
35% |
25% |
Aberdeenshire & Moray |
£166,476 |
174% |
28% |
23% |
Dunbartonshire & North Lanarkshire |
£157,335 |
151% |
9% |
9% |
Dundee & Angus |
£158,247 |
176% |
20% |
18% |
Edinburgh City |
£257,288 |
192% |
10% |
10% |
Fife |
£139,572 |
150% |
10% |
9% |
Glasgow City |
£176,608 |
167% |
10% |
9% |
Highlands & Islands |
£152,108 |
161% |
10% |
13% |
Lothian & Falkirk |
£163,052 |
154% |
9% |
10% |
Perthshire & Stirling |
£162,314 |
145% |
9% |
6% |
Renfrewshire & Inverclyde |
£171,447 |
161% |
12% |
12% |
South Lanarkshire |
£148,511 |
144% |
11% |
10% |
Southern Scotland |
£142,928 |
162% |
8% |
6% |
Northern Ireland (click here to return to commentary)
Nationwide Sub-Regions |
Price in 2007 Q4 |
% change over 10 years |
Annual Chg - Last quarter |
Annual Chg - This quarter |
City of Belfast |
£306,698 |
363% |
50% |
32% |
Northern Ireland (North East) |
£238,312 |
321% |
54% |
37% |
Northern Ireland (South East) |
£253,254 |
301% |
42% |
29% |
Northern Ireland (West) |
£204,569 |
265% |
38% |
28% |
Wales (click here to return to commentary)
Nationwide Sub-Regions |
Price in 2007 Q4 |
% change over 10 years |
Annual Chg - Last quarter |
Annual Chg - This quarter |
Cardiff |
£209,230 |
196% |
5% |
4% |
Mid & West Wales |
£168,126 |
217% |
7% |
8% |
North Wales |
£174,826 |
197% |
4% |
3% |
South Wales (East) |
£175,748 |
207% |
12% |
9% |
South Wales (West) |
£156,833 |
169% |
4% |
0% |
North (click here to return to commentary)
Nationwide Sub-Regions |
Price in 2007 Q4 |
% change over 10 years |
Annual Chg - Last quarter |
Annual Chg - This quarter |
Cumbria |
£159,705 |
191% |
4% |
7% |
Durham |
£147,959 |
162% |
4% |
1% |
Northumberland |
£170,073 |
187% |
8% |
9% |
Teeside |
£159,080 |
178% |
2% |
2% |
Tyne and Wear |
£163,851 |
181% |
3% |
1% |
North West (click here to return to commentary)
Nationwide Sub-Regions |
Price in 2007 Q4 |
% change over 10 years |
Annual Chg - Last quarter |
Annual Chg - This quarter |
Cheshire |
£191,574 |
175% |
3% |
5% |
City of Manchester |
£206,181 |
210% |
6% |
4% |
Greater Manchester |
£175,625 |
180% |
4% |
5% |
Lancashire |
£163,027 |
180% |
5% |
5% |
Merseyside |
£160,691 |
191% |
5% |
2% |
Warrington & Halton |
£176,275 |
182% |
4% |
4% |
Yorkshire & Humberside (click here to return to commentary)
Nationwide Sub-Regions |
Price in 2007 Q4 |
% change over 10 years |
Annual Chg - Last quarter |
Annual Chg - This quarter |
Bradford |
£175,331 |
190% |
6% |
4% |
East Yorkshire |
£158,785 |
181% |
6% |
4% |
Leeds |
£195,521 |
179% |
6% |
2% |
North Lincolnshire |
£141,614 |
189% |
6% |
7% |
North Yorkshire |
£208,317 |
199% |
6% |
7% |
Sheffield |
£181,630 |
193% |
17% |
1% |
South Yorkshire |
£153,229 |
184% |
3% |
7% |
West Yorkshire |
£165,012 |
162% |
5% |
3% |
York |
£224,872 |
215% |
9% |
6% |
East Anglia (click here to return to commentary)
Nationwide Sub-Regions |
Price in 2007 Q4 |
% change over 10 years |
Annual Chg - Last quarter |
Annual Chg - This quarter |
Cambridgeshire |
£217,221 |
167% |
6% |
8% |
Norfolk |
£188,374 |
205% |
5% |
4% |
Peterborough |
£177,698 |
207% |
11% |
9% |
Suffolk |
£199,658 |
194% |
9% |
8% |
East Midlands (click here to return to commentary)
Nationwide Sub-Regions |
Price in 2007 Q4 |
% change over 10 years |
Annual Chg - Last quarter |
Annual Chg - This quarter |
Derby |
£170,941 |
191% |
1% |
1% |
Derbyshire |
£169,118 |
179% |
5% |
3% |
Leicestershire |
£181,985 |
180% |
5% |
4% |
Mid Lincolnshire |
£158,023 |
195% |
2% |
3% |
Northampton Town |
£187,927 |
184% |
4% |
2% |
Northamptonshire |
£185,426 |
188% |
7% |
5% |
Nottingham |
£151,135 |
163% |
4% |
0% |
Nottinghamshire |
£160,611 |
166% |
2% |
2% |
South Lincolnshire |
£166,564 |
207% |
6% |
3% |
West Midlands (click here to return to commentary)
Nationwide Sub-Regions |
Price in 2007 Q4 |
% change over 10 years |
Annual Chg - Last quarter |
Annual Chg - This quarter |
Birmingham |
£179,726 |
189% |
2% |
1% |
Coventry |
£173,626 |
202% |
4% |
5% |
Greater Birmingham |
£176,107 |
163% |
6% |
3% |
Herefordshire |
£189,902 |
175% |
1% |
-2% |
Shropshire |
£182,711 |
181% |
9% |
5% |
Staffordshire |
£172,185 |
165% |
5% |
6% |
Warwickshire |
£202,803 |
166% |
4% |
4% |
Worcestershire |
£202,775 |
178% |
6% |
6% |
South West (click here to return to commentary)
Nationwide Sub-Regions |
Price in 2007 Q4 |
% change over 10 years |
Annual Chg - Last quarter |
Annual Chg - This quarter |
Bath |
£245,124 |
186% |
10% |
5% |
Bournemouth |
£251,154 |
226% |
9% |
8% |
Bristol |
£240,850 |
251% |
17% |
12% |
Cheltenham |
£245,603 |
205% |
5% |
6% |
Cornwall and Isles of Scilly |
£217,180 |
256% |
8% |
9% |
Dorset |
£245,561 |
200% |
7% |
8% |
Gloucestershire |
£213,733 |
176% |
9% |
6% |
North Devon |
£214,339 |
233% |
9% |
13% |
Plymouth |
£182,461 |
227% |
9% |
9% |
Poole |
£251,583 |
199% |
6% |
6% |
Somerset |
£208,838 |
210% |
6% |
7% |
South Devon |
£220,806 |
220% |
5% |
4% |
South Gloucestershire |
£228,738 |
212% |
13% |
8% |
Swindon |
£197,389 |
165% |
8% |
4% |
Wiltshire |
£218,199 |
167% |
6% |
2% |
Outer South East (click here to return to commentary)
Nationwide Sub-Regions |
Price in 2007 Q4 |
% change over 10 years |
Annual Chg - Last quarter |
Annual Chg - This quarter |
Basingstoke & Deane |
£248,937 |
158% |
9% |
8% |
Brighton & Hove |
£307,606 |
262% |
12% |
11% |
East Kent |
£212,334 |
220% |
8% |
9% |
East Sussex |
£238,395 |
215% |
9% |
12% |
Isle of Wight |
£208,154 |
247% |
6% |
8% |
Mid Hampshire |
£270,464 |
178% |
12% |
12% |
Milton Keynes & Aylesbury |
£241,912 |
198% |
9% |
8% |
New Forest |
£255,952 |
172% |
14% |
9% |
North Essex |
£222,400 |
191% |
7% |
9% |
Oxfordshire |
£275,561 |
181% |
13% |
11% |
Portsmouth Area |
£195,995 |
184% |
8% |
7% |
Southampton Area |
£227,804 |
181% |
8% |
7% |
West Berkshire |
£267,249 |
158% |
11% |
10% |
West Sussex (South) |
£253,006 |
201% |
13% |
13% |
Outer Metropolitan (click here to return to commentary)
Nationwide Sub-Regions |
Price in 2007 Q4 |
% change over 10 years |
Annual Chg - Last quarter |
Annual Chg - This quarter |
Bedford & Mid Bedfordshire |
£219,832 |
207% |
10% |
11% |
Bracknell Forest |
£267,165 |
144% |
15% |
12% |
Central Kent |
£248,669 |
179% |
10% |
7% |
East Surrey |
£310,663 |
178% |
14% |
14% |
Hart & Rushmoor |
£269,617 |
168% |
14% |
12% |
Hertfordshire |
£274,957 |
177% |
10% |
8% |
Luton & South Bedfordshire |
£213,384 |
203% |
8% |
7% |
Medway |
£197,304 |
196% |
8% |
7% |
North Surrey |
£315,014 |
163% |
15% |
13% |
Reading |
£256,439 |
188% |
15% |
12% |
Slough |
£285,978 |
204% |
11% |
10% |
South Buckinghamshire & Chilterns |
£300,237 |
158% |
9% |
8% |
South Essex |
£241,897 |
198% |
8% |
9% |
St Albans |
£347,563 |
165% |
12% |
13% |
West Kent |
£255,950 |
171% |
7% |
12% |
West Surrey |
£314,369 |
176% |
11% |
10% |
West Sussex (North) |
£266,064 |
179% |
10% |
9% |
Windsor & Maidenhead |
£315,060 |
145% |
14% |
10% |
Wokingham |
£282,177 |
158% |
15% |
12% |
London (click here to return to commentary)
London Boroughs |
Price in 2007 Q4 |
% change over 10 years |
Annual Chg - Last quarter |
Annual Chg - This quarter |
Barking and Dagenham |
£225,409 |
246% |
11% |
14% |
Barnet |
£322,483 |
188% |
15% |
14% |
Bexley |
£234,845 |
186% |
8% |
10% |
Brent |
£334,041 |
243% |
14% |
13% |
Bromley |
£275,403 |
190% |
12% |
14% |
Camden |
£505,037 |
192% |
26% |
18% |
Croydon |
£255,532 |
207% |
15% |
14% |
Ealing |
£361,773 |
225% |
16% |
17% |
Enfield |
£294,781 |
240% |
20% |
20% |
Greenwich |
£273,131 |
205% |
14% |
5% |
Hackney |
£359,736 |
281% |
11% |
7% |
Hammersmith and Fulham |
£518,470 |
214% |
24% |
29% |
Haringey |
£388,754 |
257% |
26% |
32% |
Harrow |
£298,288 |
198% |
15% |
13% |
Havering |
£242,053 |
200% |
12% |
15% |
Hillingdon |
£288,120 |
198% |
12% |
12% |
Hounslow |
£318,040 |
201% |
13% |
19% |
Islington |
£474,213 |
260% |
31% |
21% |
Kingston upon Thames |
£352,439 |
219% |
23% |
19% |
Lambeth |
£370,712 |
248% |
22% |
22% |
Lewisham |
£296,964 |
287% |
18% |
18% |
Merton |
£353,547 |
218% |
13% |
14% |
Newham |
£276,439 |
353% |
13% |
19% |
Redbridge |
£273,957 |
233% |
12% |
10% |
Richmond upon Thames |
£412,477 |
194% |
17% |
17% |
Southwark |
£383,378 |
267% |
20% |
21% |
Sutton |
£270,404 |
195% |
14% |
12% |
Tower Hamlets |
£402,246 |
238% |
22% |
19% |
Waltham Forest |
£292,171 |
282% |
18% |
17% |
Wandsworth |
£436,120 |
225% |
21% |
20% |
Westminster |
£657,100 |
283% |
18% |
31% |
Notes:
- Prices differ to main Nationwide index because sub-regional analysis is based on a different methodology. Sub-regional analysis is based on the average price per square foot in each of the sub-regions. This is grossed up by the average square footage in a particular region to arrive at an average house price. Unlike Nationwide’s main index, this methodology does not take into account the different mix of properties transacted and is therefore a simplification. Because of the different methodologies the two series are not directly comparable.
- House price growth based on prices in the last two quarters compared with the same period in earlier years
Text in blue indicates hyperlinks to move throughout this document.
Fionnuala Earley Kate Cremin
Chief Economist External Affairs
Tel: 01793 656370 Tel: 01793 656517
fionnuala.earley@nationwide.co.uk kate.cremin@nationwide.co.uk
Notes:
Indices and average prices for the UK and the regions are produced using Nationwide's updated mix adjusted House Price Methodology which was introduced with effect from the first quarter of 1995. All changes are nominal and do not allow for inflation. The methodology can be found on our website: http://www.nationwide.co.uk/hpi/
Price indices are seasonally adjusted using the US Bureau of the Census X12 method. Quarterly series are seasonally adjusted using data since 1973. The seasonal adjustment is recalculated quarterly and may lead to revisions.
The price changes in the sub regional, and local authority tables are based on the price per unit area of the properties in the sample. Samples are smaller than at a regional level and figures should not be relied upon for any critical application. Figures are not directly comparable with mix-adjusted indices.
Think carefully before securing other debts against your home, your home may be repossessed if you do not keep up repayments on your mortgage.
Go Direct.co.uk is a trading style for website purposes of Go Direct UK Ltd.
Go Financial Services is a trading style of Go Direct UK Ltd which is an appointed representative of Personal Touch Financial Services Ltd which is authorised and regulated by the Financial Conduct Authority. Registered in England & Wales Company 5703224. FCA Number 456600
We normally do not charge a fee for mortgage advice, however this is dependent on your circumstances. Our typical fee would be £349